ArcGIS Online is a cloud-based GIS platform for using, creating, and sharing maps, apps and data within and across organizations. You can try out ArcGIS Online by signing up for the 21-day free ArcGIS trial. Find out how you can make the best use of your free trial period.
Introduction
With the 21-day free ArcGIS trial you get the following:
- Access to ArcGIS Online for up to (3) viewers and (2) contributors.
- ArcGIS Pro desktop software.
- A suite of ready-to-use ArcGIS Apps for the office, field, and community that can be accessed on browsers, desktops, and mobile devices.
- ArcGIS Living Atlas of the World that includes maps and data on thousands of topics.
- 400 ArcGIS Online service credits that can be used for data storage, premium data access, performing geocoding, analysis, and more.
You could use the 21-day period to explore ArcGIS Pro or any of the other ArcGIS Apps, but ArcGIS Online forms the centerpiece of a cloud GIS implementation. You can read about cloud GIS in Will You Join the Cloud GIS Revolution?, but ease-of-use and reduced capital expenditure are two major benefits which make GIS accessible to the smallest of organizations.
ArcGIS Online Top Functions
Exploring all the features and benefits that ArcGIS Online offers in a 21-day period is a tall order. Following are some of the functions that you should focus on in your journey of discovery.
Finding Content
ArcGIS Online comes with a collection of ready to use of maps organized by region and category. Data from the Living Atlas of the World are the starting point for authoritative content in ArcGIS Online. Click the Content menu, choose the Living Atlas tab and start exploring.
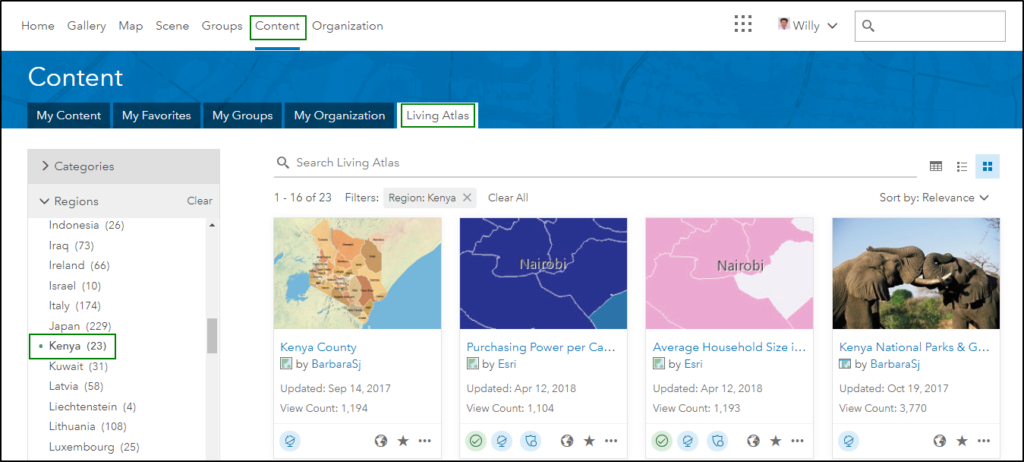
Here is some of the relevant content that you can find:
- Kenya – The best maps in the authoritative content of the Living Atlas are Kenya County, Physical Features in Kenya (contains lakes, rivers, forests, and wetlands), Kenya Protected Areas and Wetlands.
- World Vector Maps – By default ArcGIS Online offers a choice between 10 different basemaps (e.g. Topographic, Imagery, OpenStreetMap), but in the Living Atlas you find many more basemaps, and references for countries, cities, place names and boundaries. Check out the World Traffic Service which is updated every 5 minutes to show real-time traffic.
- World Imagery – The Living Atlas gives access to the latest 30m resolution multi-spectral imagery from Landsat 8 and Sentinel 2. The imagery can be filtered by date and displayed using different band combinations, making it a powerful analysis tool. The World Imagery Wayback gives access to archived world imagery dating back to 2014 and can be used for change detection.
The Living Atlas has limited data for Kenya in comparison to countries that leverage the ArcGIS Online platform to publish their authoritative national data. But the GIS community in Kenya has been sharing their work with the public through ArcGIS Online. This content is not authoritative, but you’ll find some of it useful. For example, Kenya Roads Board published the Kenya Road Network as a tile layer that can be used as a basemap. You can find other relevant layers by searching ArcGIS Online with relevant keywords and filters.

Adding Content
Rather than looking for published maps you can add new content to ArcGIS Online. Such content may be stored on local disk as an Excel spreadsheet or GIS shapefile or obtained from the web through a URL. Some file types can be added directly to the Map Viewer, but from the Contents tab you can add a wider selection of file types.
When adding an Excel spreadsheet or CSV-file, publish it as a hosted layer so that it is accessible on ArcGIS Online. In addition, choose the appropriate location reference for your features which could take the form of a Lat, Long pair or a geographic address (e.g. address, town, country).

When adding an item from the web, just choose the type of web service and copy and paste the URL.

Data in Kenya is not always available in a structured and reusable format like a .csv file or a web service, but that might change with an increase in demand. If you have difficulty finding relevant content, you could use FinAccess Geospatial Mapping 2013 on Harvard Dataverse.
Smart Mapping
ArcGIS Online makes it easy to create beautiful maps with a data-driven concept dubbed Smart mapping. Smart mapping removes the guesswork from symbolizing your data through data-driven ‘Smart’ defaults. To access Smart mapping let us open the FSP data for Kenya in the Map Viewer and select the Change Style option.

We can now create compelling map visualizations by following the 3 easy steps.
- Choose an attribute to show – By default the FSP data is shown by location using a uniform symbol. To symbolize the FSPs by type we can pick the attribute Form Name from the attribute drop-down list.
- Select a drawing style – On selecting the attribute the drawing style changes from Location (Single symbol) to Types (Unique symbols). A preview of the data is created, which makes it easy to explore other drawing styles for our data.
- Explore the Options – Clicking the Options button allows us to tweak the legend labels, feature symbology, transparency and visibility, but the default values often suffice.
The smart defaults work particularly well for novice users, but experienced cartographers could explore advanced options for data visualization.
- Clustering – A large number of point features may clutter the map display. In such a case, click the Clustering Points option for the layer and configure clustering until the required distribution of your data is obtained.

- Compare A to B – The ratio between two attributes can be visualized by selecting two attributes and the Compare A to B drawing style. The example below clearly shows the strongholds of Uhuru Kenyatta and Raila Odinga in Kenya’s 2017 presidential election.

- Relationship – The relationship drawing style can be used to visualize the relationship between two attributes. The example below shows the relationship between road density and population density for counties in Kenya.

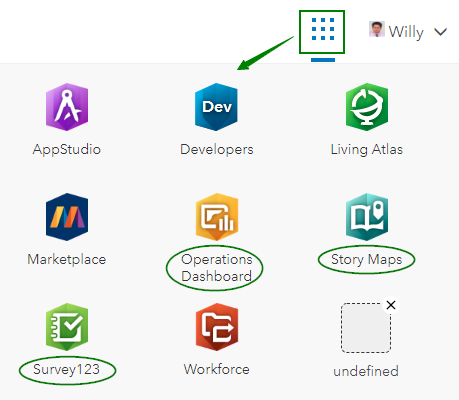
Explore Applications
ArcGIS Online comes with a collection of apps for field, office, community, and developers. Some apps are delivered as configurable web templates, while others are native apps for mobile and desktop. The array of apps can be difficult to navigate, but you might want to explore Survey123, Story Maps and Operations Dashboard. To start exploring click the Apps button in ArcGIS Online.
- Survey123 – Survey123 makes it easy to design form-based surveys for field data collection. Once the survey is published and shared on ArcGIS Online it can be deployed for field data collection on GPS enabled devices like smartphones and tablets. The data that is collected in the field can be immediately uploaded to ArcGIS Online, making it available for analysis and visualization.

- Story Maps – Story Maps let you combine authoritative maps with text, images and multimedia content to tell compelling stories. Story Maps are ideal for introducing your organization, the work that you do, and the causes you support. You can choose from a variety of Story Maps templates, but Map Tour and Shortlist are the easier ones to use.

- Operations Dashboard – Dashboards in ArcGIS Online help you to keep an eye on activities and events and provide critical insights for action and decision-making. An Operations Dashboard typically consists of a dynamic map surrounded by other dashboards elements such as data, graphs, indicators and gauges. The Philadelphia Crime Dashboard below illustrates how Operations Dashboard creates a common operational picture.

Creating Web Maps & Apps
Content hosted on ArcGIS Online can be combined and visualized to create web maps with the Map Viewer. These web maps can then be embedded in websites or shared as web apps. Web apps can be created using the configurable apps, Web AppBuilder or Operations Dashboard. The configurable apps are a good starting point since they have been pre-configured for common use cases. Follow these steps to develop a great web app.
- Content preparation – Obtain the required data layers for your web app and symbolize them in the map viewer using the methods discussed above.
- Configure pop-ups – Pop-ups appear when you click a feature in the map, and it’s important the pop-up contains relevant information in a format that is easy to understand. The example below shows the pop-up for the 2017 presidential elections in Kenya.

- Create web app – Web maps can be shared in a few simple steps by clicking Share in the Map Viewer, followed by Create a Web Map in the window that pops up. As a next step you might want to pick the configurable app that is appropriate for the story you want to tell.

Perform Analysis
ArcGIS Online is a powerful platform for various kinds of analysis which derive new information from your existing data. The analysis tools are grouped in categories such as Summarize Data, Analyze Patterns, Use Proximity etc. Reading the information about the various tools is a good introduction to the different types of analysis that a GIS can perform. Have some fun and use Create Drive-Time Areas under Proximity to see how far you can walk from your home or office in a certain time.

Administration
One ArcGIS Online user needs to take on the role of Administrator, which entails configuring the ArcGIS Online account for the organization, adding members and assigning them roles and licenses, tracking and controlling credit usage, and managing content. Administrators can use the trial period to understand the privileges of the different levels and roles, and experiment with the sharing of content at different levels (everyone (public), organization, specific groups).
Wrapping Up
We have just seen that ArcGIS Online is a mature cloud-based GIS platform that allows you to find, create, use, create and share maps and apps with a difference. The platform complements traditional desktop and server GIS implementations and can be leveraged within and across organizations.
This article is a good resource to those who want to try out ArcGIS for a free 21-day period. Even so it will be a tall order for any organization to experience the full benefits that ArcGIS Online has to offer. The good news is that qualified customers will be able to evaluate ArcGIS Online for up to 90 days. Spatiality has the capacity to manage the evaluation, and subsequent deployment and implementation of ArcGIS Online, so do not hesitate to contact us for further details or information.